
Reports
See where the revenue actually comes from.
Revenue, booking volume and cancellations across the last 12 months, broken down by service, by team member and by branch — no spreadsheet required.
Part of every plan — nothing to switch on.
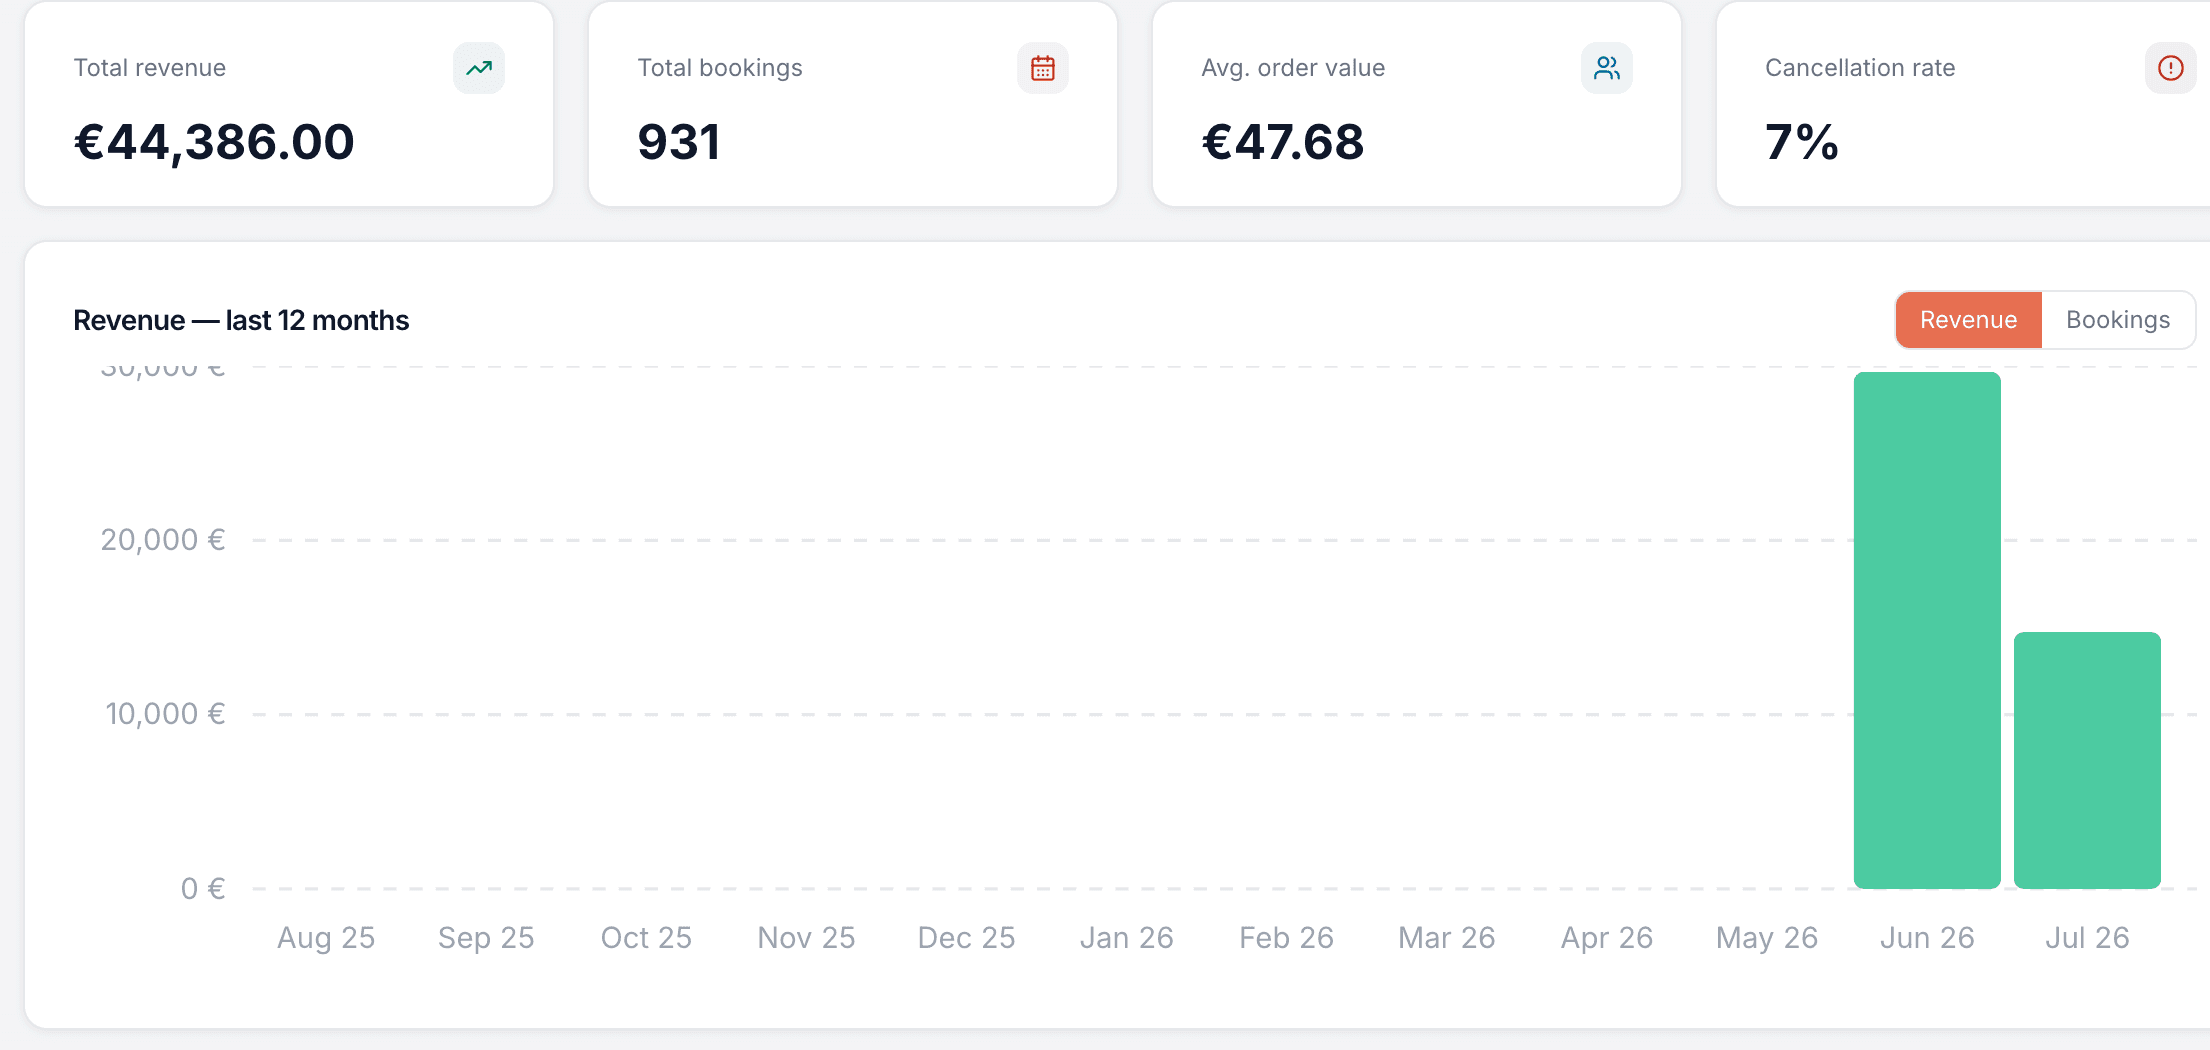
The headline numbers
Total revenue, total bookings, average order value and cancellation rate for the period — right at the top, no digging.
Revenue, month by month
Revenue and bookings charted across the last 12 months, so the busy seasons and the quiet spells are easy to see coming.
Where bookings stand
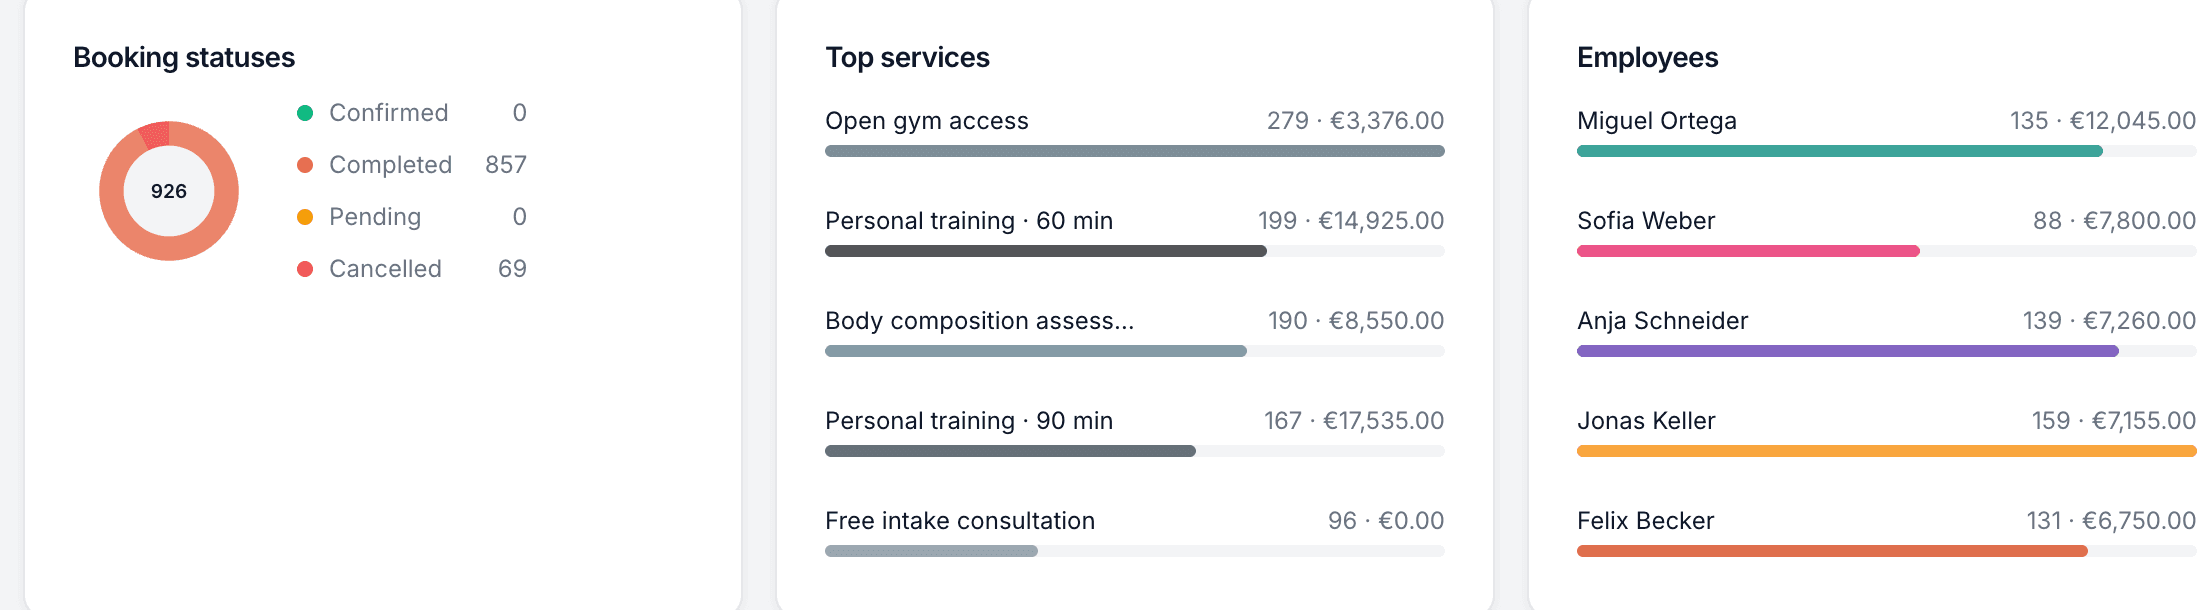
A clean split of confirmed, completed, pending and cancelled bookings, so nothing quietly slips through.
Your top services
Which services bring in the most bookings and the most money — and which ones aren't pulling their weight.
Who's busiest
Team members ranked by the revenue they've booked, so strong performers and quiet weeks both stand out.
All branches, or just one
Roll every location into a single view, or filter down to one branch at a time — the numbers re-add themselves.
See what sells and who delivers
Under the headline figures, the detail that actually changes what you do next: how bookings are splitting across statuses, which services earn their place, and how each team member is performing — ranked, with the numbers right beside them.
- Booking statuses at a glance — confirmed, completed, pending, cancelled
- Top services by both volume and revenue, side by side
- Team members ranked by revenue, with a branch label when you run more than one
Common questions
- What period do the reports cover?
- The last 12 months. The revenue and bookings charts run month by month across the year, and the totals, top services and team ranking are calculated over that window.
- Can I see revenue per team member?
- Yes. The team is ranked by the revenue they've booked, with their booking count next to each name — and a branch label too, if you run more than one location.
- Does it work across multiple branches?
- Yes. Run all your locations into one combined view, or filter to a single branch. In the combined view the monthly chart stacks each branch so you can see who's contributing what.
- Can I switch between revenue and bookings?
- Yes. The main chart toggles between revenue and booking volume, and there's a separate chart for new customers over the same 12 months.
- Do I need to set anything up?
- No. Reports build themselves from your bookings — every confirmed, completed and cancelled appointment is counted automatically.
Reports is in every Bookodile account
Along with everything else you need to take bookings — nothing to switch on, no add-on required.